Notebook source code:
notebooks/how_to/17_vis_dist.ipynb
Run it yourself on binder
![]()
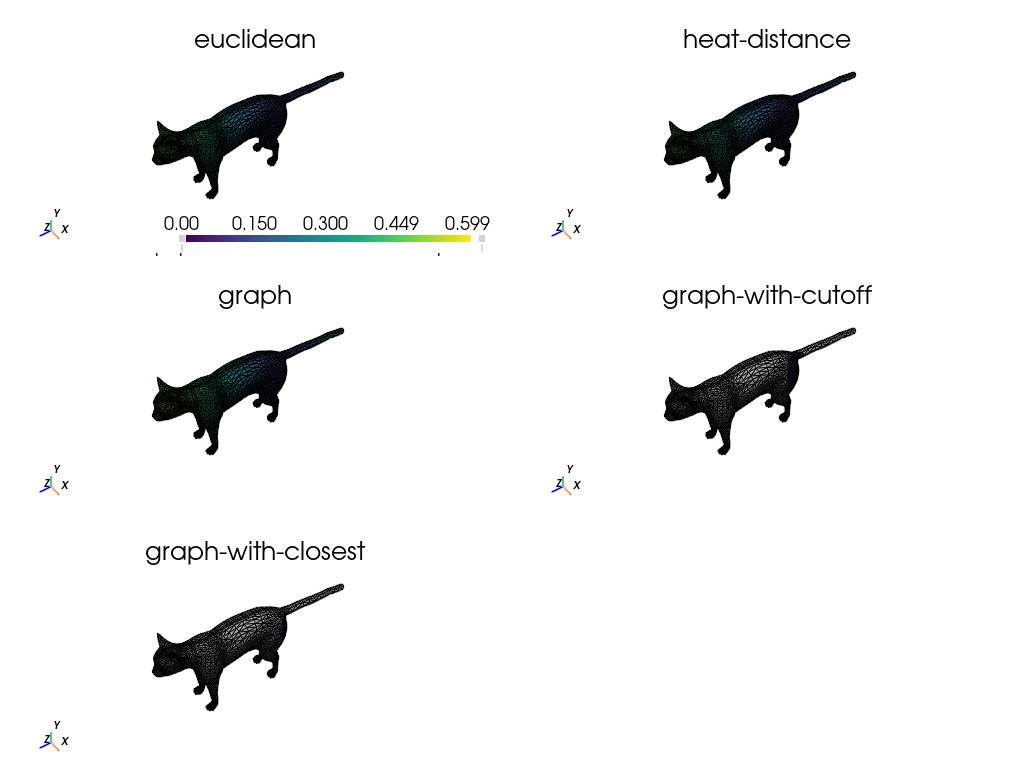
How to visualize distance to a point in a mesh?#
In this notebook, we consider different distance functions on a metric and visualize the results.
In [ ]:
import sys
from pathlib import Path

import gsops.backend as gs
import numpy as np
import pyvista as pv

import geomfum
from geomfum.dataset import NotebooksDataset
from geomfum.metric import HeatDistanceMetric
from geomfum.metric.mesh import (
    GraphShortestPathMetric,
    KClosestGraphShortestPathMetric,
    VertexEuclideanMetric,
)
from geomfum.shape import TriangleMesh
In [ ]:
notebooks_dir = Path(geomfum.__file__).resolve().parents[1] / "notebooks"
notebooks_dir_str = str(notebooks_dir)
if notebooks_dir_str not in sys.path:
    sys.path.insert(0, notebooks_dir_str)

from plot_utils import pv_faces, setup_pyvista  # noqa: E402

setup_pyvista()
In [3]:
dataset = NotebooksDataset()
mesh = TriangleMesh.from_file(dataset.get_filename("cat-00"))

mesh.n_vertices, mesh.n_faces
Out [3]:
(7207, 14410)
Instantiate different metrics.
In [4]:
metrics = {
    "euclidean": VertexEuclideanMetric(mesh),
    "heat-distance": HeatDistanceMetric.from_registry(mesh, which="pp3d"),
    "graph": GraphShortestPathMetric(mesh, cutoff=None),
    "graph-with-cutoff": GraphShortestPathMetric(mesh, cutoff=0.1),
    "graph-with-closest": KClosestGraphShortestPathMetric(mesh, k_closest=100),
}
Compute distances from a source node.
In [5]:
index = 10
vertex_indices = gs.arange(mesh.n_vertices)

# bound for the colorbar
max_dist = 0.0

dists_dict = {}
for name, metric in metrics.items():
    print(metric)
    dists_, target = metric.dist_from_source(index)

    max_dist_ = gs.amax(dists_)
    if max_dist_ > max_dist:
        max_dist = max_dist_

    indices = gs.arange(mesh.n_vertices)
    dists = float("inf") * gs.ones(mesh.n_vertices)
    dists[target] = dists_

    dists_dict[name] = dists
<geomfum.metric._base.VertexEuclideanMetric object at 0x0000022371B21A10>
<geomfum.wrap.pp3d.Pp3dMeshHeatDistanceMetric object at 0x0000022373A05C50>
<geomfum.metric.mesh.GraphShortestPathMetric object at 0x000002237401BF50>
<geomfum.metric.mesh.GraphShortestPathMetric object at 0x000002235474CE50>
<geomfum.metric.mesh.KClosestGraphShortestPathMetric object at 0x0000022375F48050>
The following is also valid code, but much slower for graph shortest path-based metrics. Can guess why?
dists = metric.dist(index, vertex_indices)
Plot using pyvista.
In [6]:
inf_color = "lightgray"
pv_mesh = pv.PolyData(np.asarray(mesh.vertices), pv_faces(mesh.faces))

n_cols = 2

n_dists = len(dists_dict)
n_rows = int(n_dists / n_cols + n_dists % n_cols)

pl = pv.Plotter(shape=(n_rows, n_cols), border=False)

for index, (name, dists) in enumerate(dists_dict.items()):
    row, col = index // n_cols, index % n_cols
    pl.subplot(row, col)

    pl.show_axes()
    pl.add_mesh(
        pv_mesh,
        show_edges=True,
        scalars=dists,
        clim=[0, max_dist],
        below_color=inf_color,
        above_color=inf_color,
        copy_mesh=True,
    )

    pl.camera.roll = 0
    pl.camera.azimuth = 10
    pl.camera.elevation = 10
    pl.add_title(name, font_size=10)

pl.show()